POWERFUL DASHBOARD
UNIQUE TO YOU AND
YOUR ORGANIZATION
This financial tool releases you from stress and
uncertainty about your numbers.
POWERFUL DASHBOARD
UNIQUE TO YOU AND
YOUR ORGANIZATION
This financial tool releases you from stress and
uncertainty about your numbers.
A dashboard helps you anticipate problems before they actually happen. If you run an online business you already know how it can be time consuming and require a great deal of effort to gather all your financial data in one place, each month.
Meanwhile if you’re not doing that, you expose yourself to serious risks on the long run to take strategic decisions based on outdated financial data. Activity Dashboard is designed upon the characteristics of your business and connect efficiently with your services. You can now see all your key financial metrics anytime, anywhere.

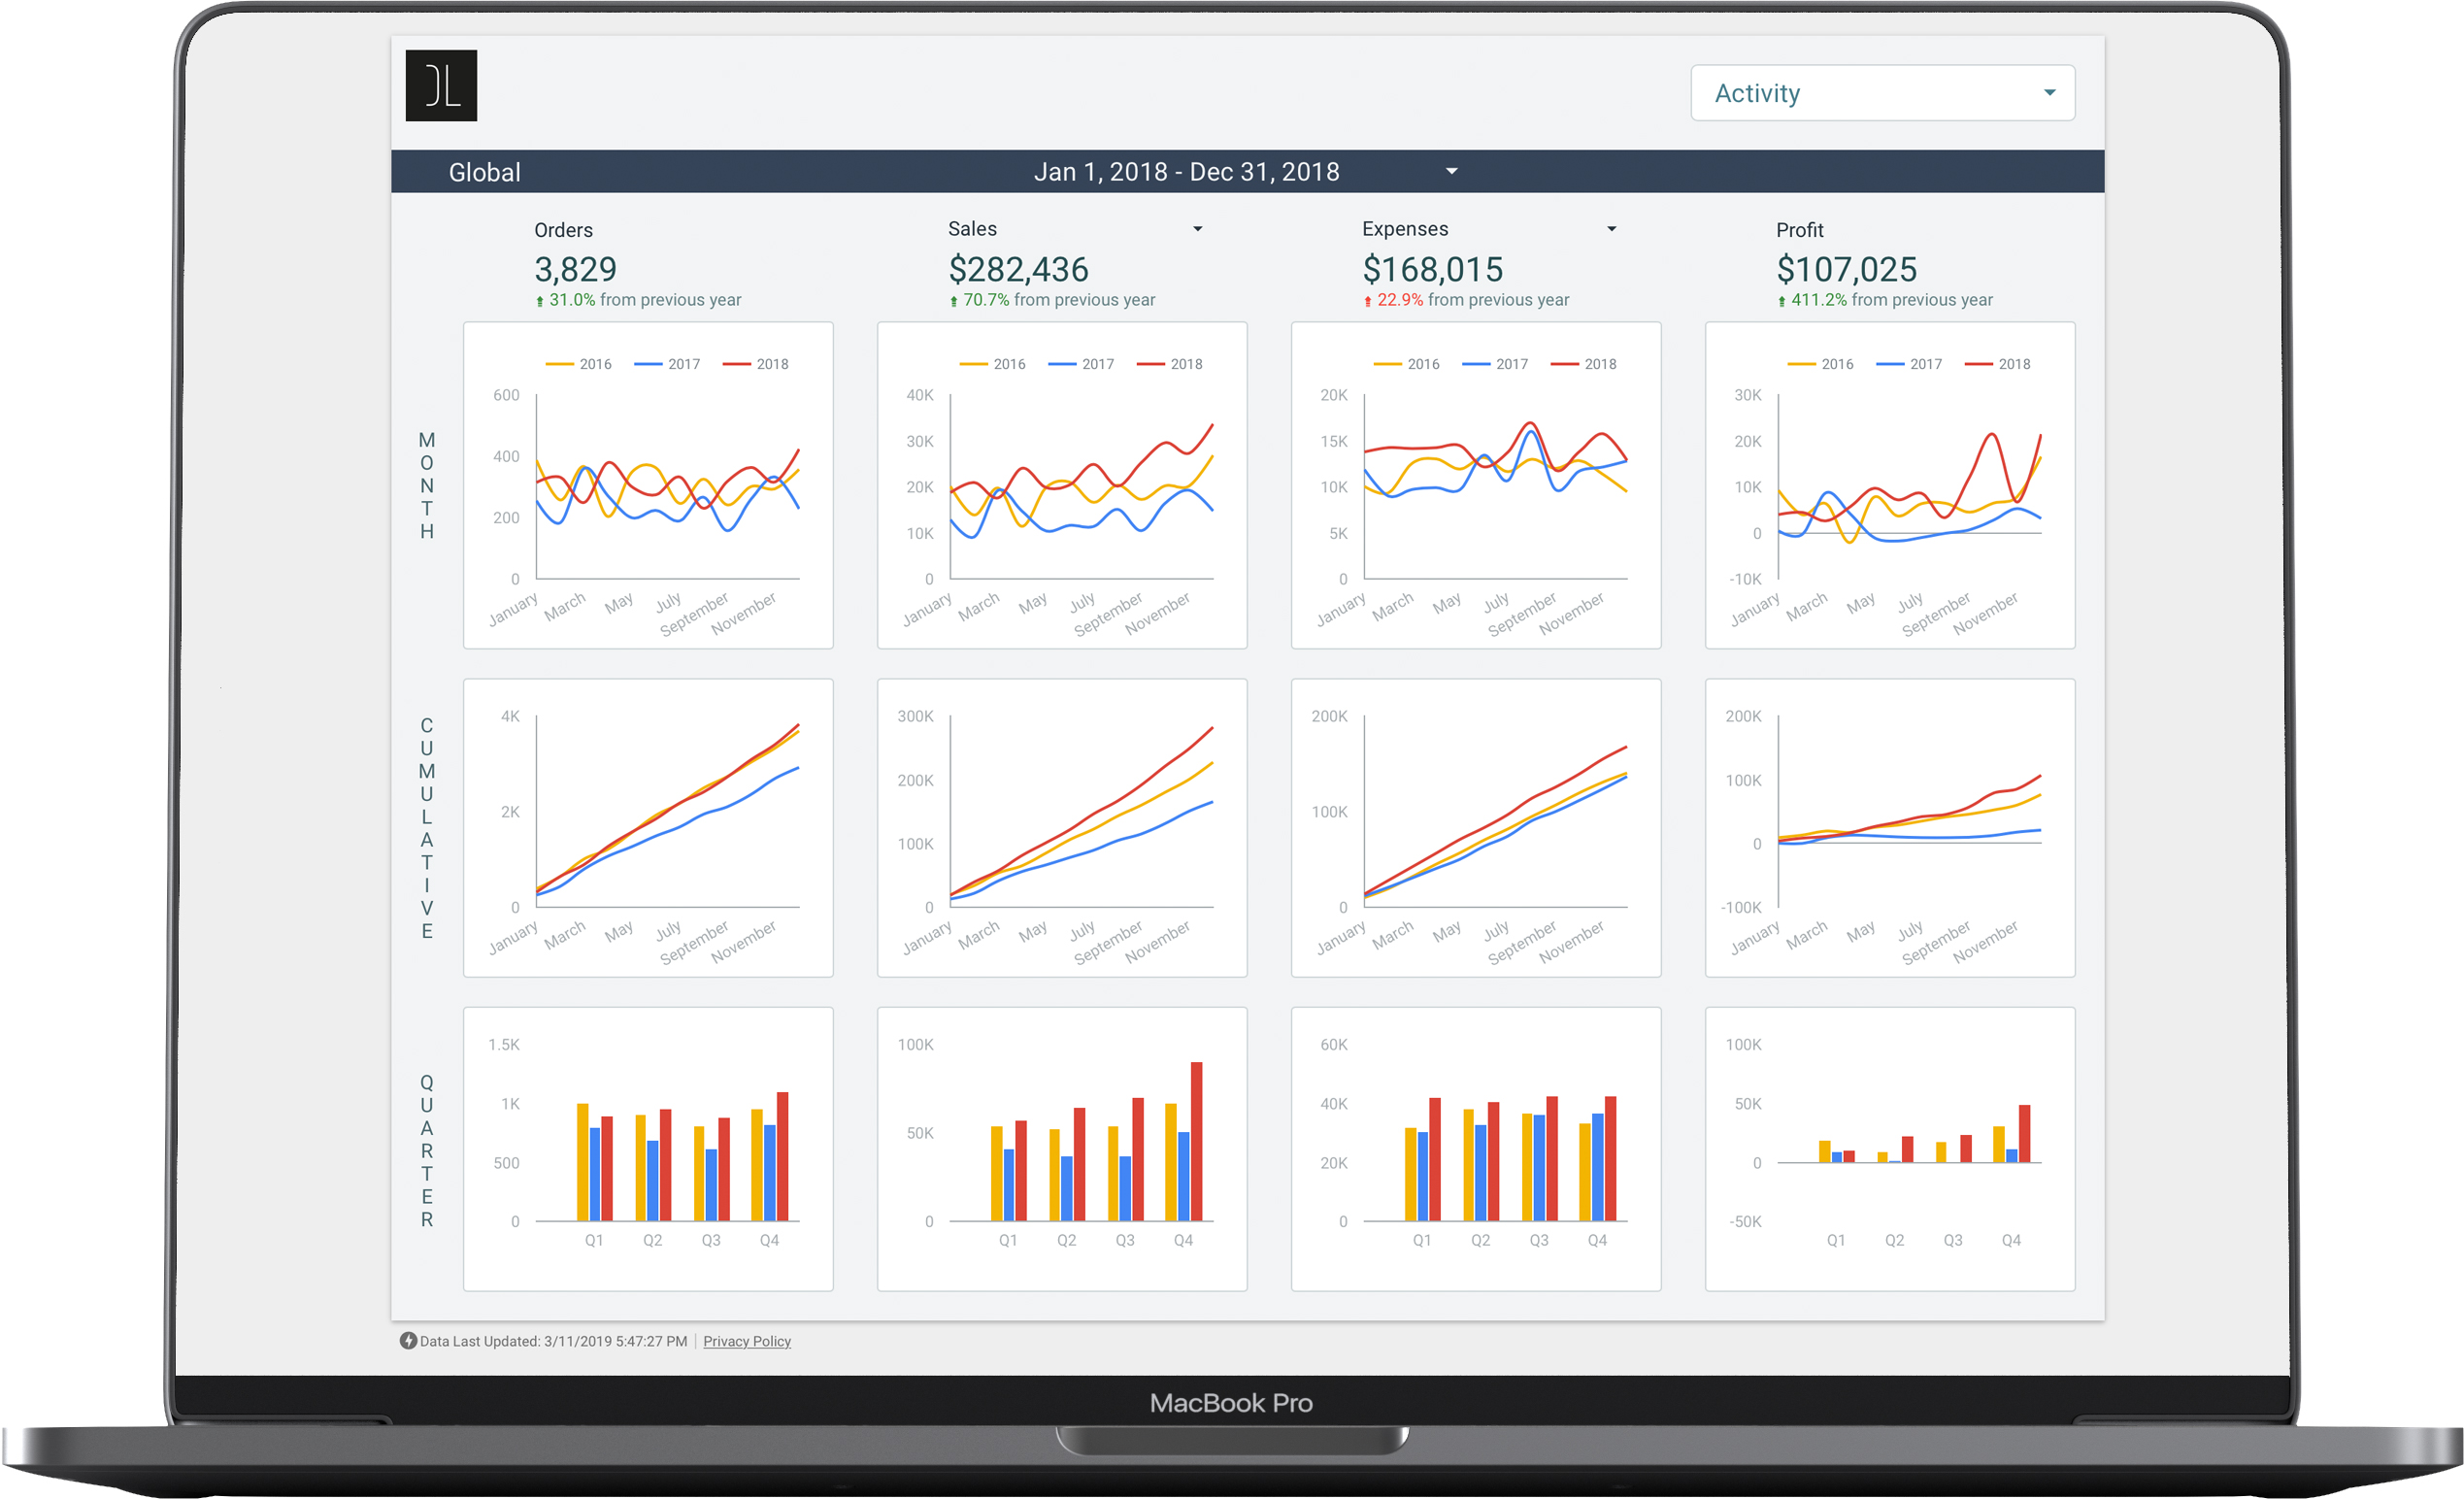
Choose Among Your Activity
Check the filter to select only numbers of a certain activity, distribution channel or leave them global.
Pick a Date
Go back in time as far as your data allow and select a specific period to analyse the trends.
Keep an Eye on Trends
View your datas in all their forms by month, quarter, cumulated or not years after years.
Get a quick global picture of what is currently happening on your revenue, spending, cash flow, and much more.
These data represent the ones we decided together to give the most importance for you and your organization based on your decision-making process.
Other data are more important than others. For example you’ve just launched a new product and you would like to keep an eye on it, or you absolutely don’t want to be out of stock and need an easy access to this info. Every situations are worth considering.
Now all your sales reporting is in one place.
If you’re using a whole suite of home-made reports, chances are you’re dealing with inaccurate data. Precision is difficult to reach and the few errors that are left over can make a difference between reaching your objectives or not.
Complexity increases as your business is growing. Activity Dashboard takes care of all the tricky situations.
Navigate between different higher views perspectives or drill down to see trends from your products, customers, discounts, refunds, and churn.

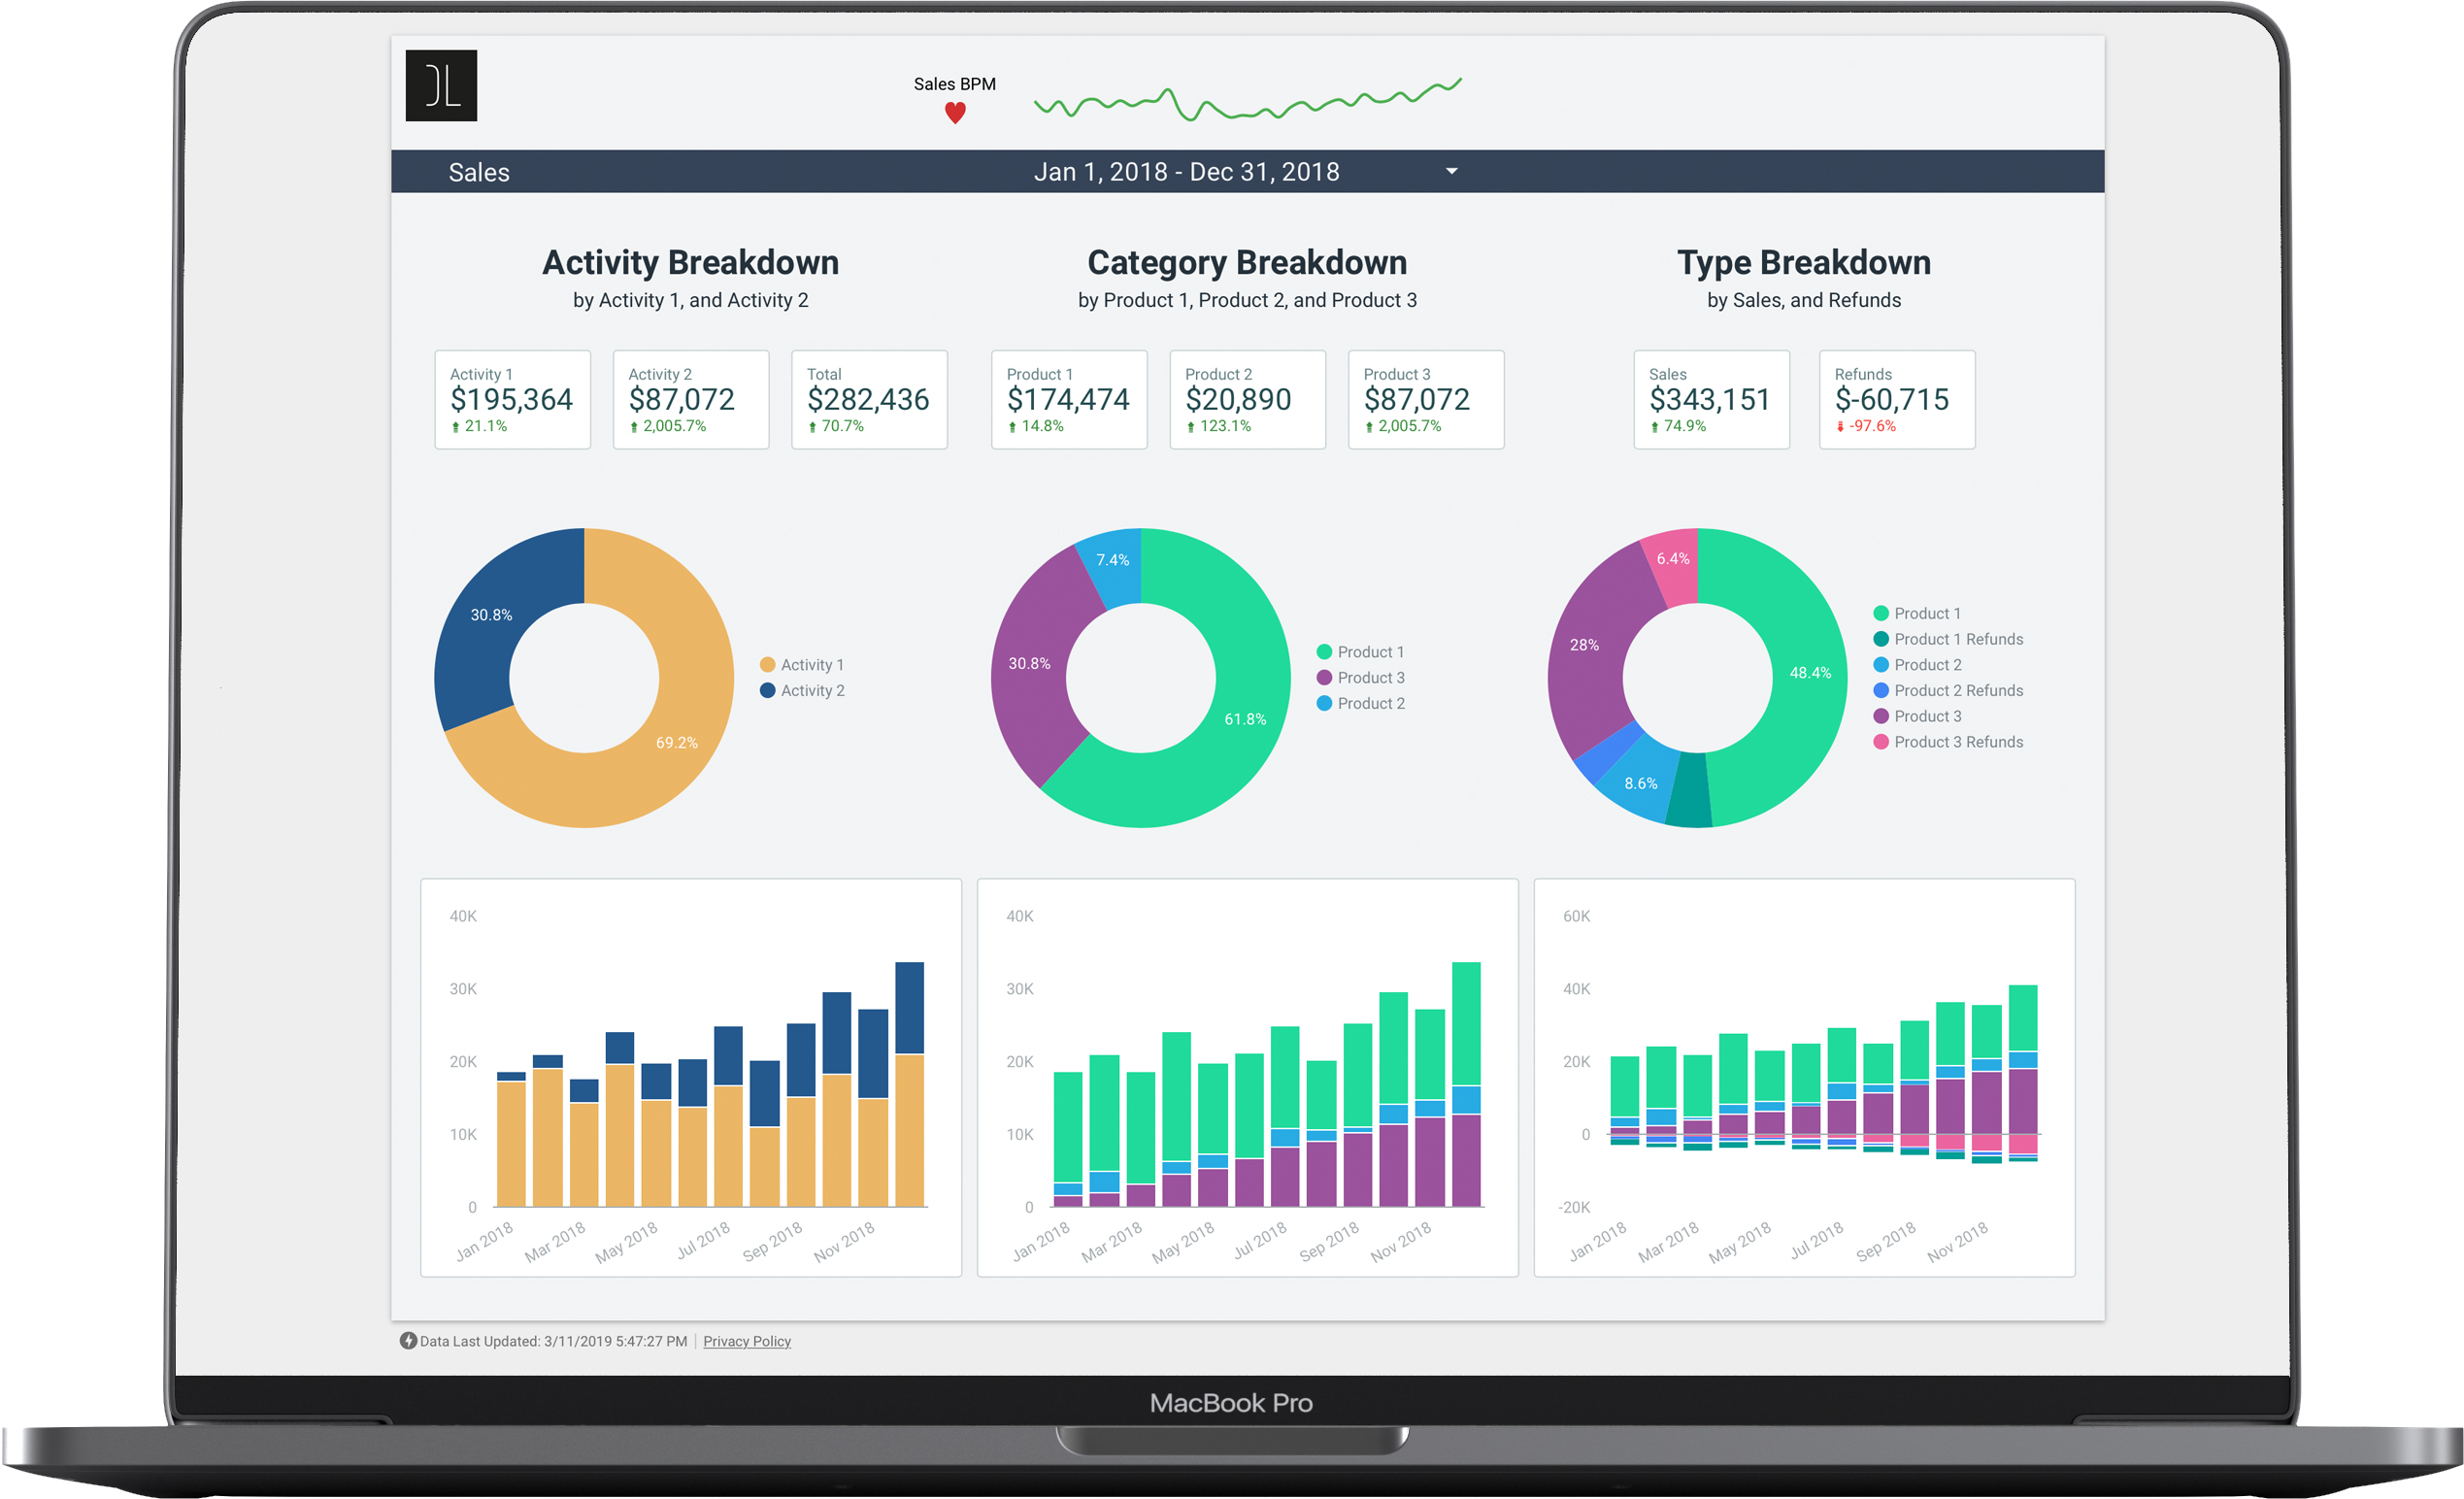
Sales Health
Quick view on your sales trend since the first datas recorded. Great way to spot trend reversal.
Smart Breakdown
Each breakdown equals the one next to it, widen your view by looking from different perspectives.
Total Interactivity
Only select the data you want to display by clicking on it, all charts will adjust automatically.

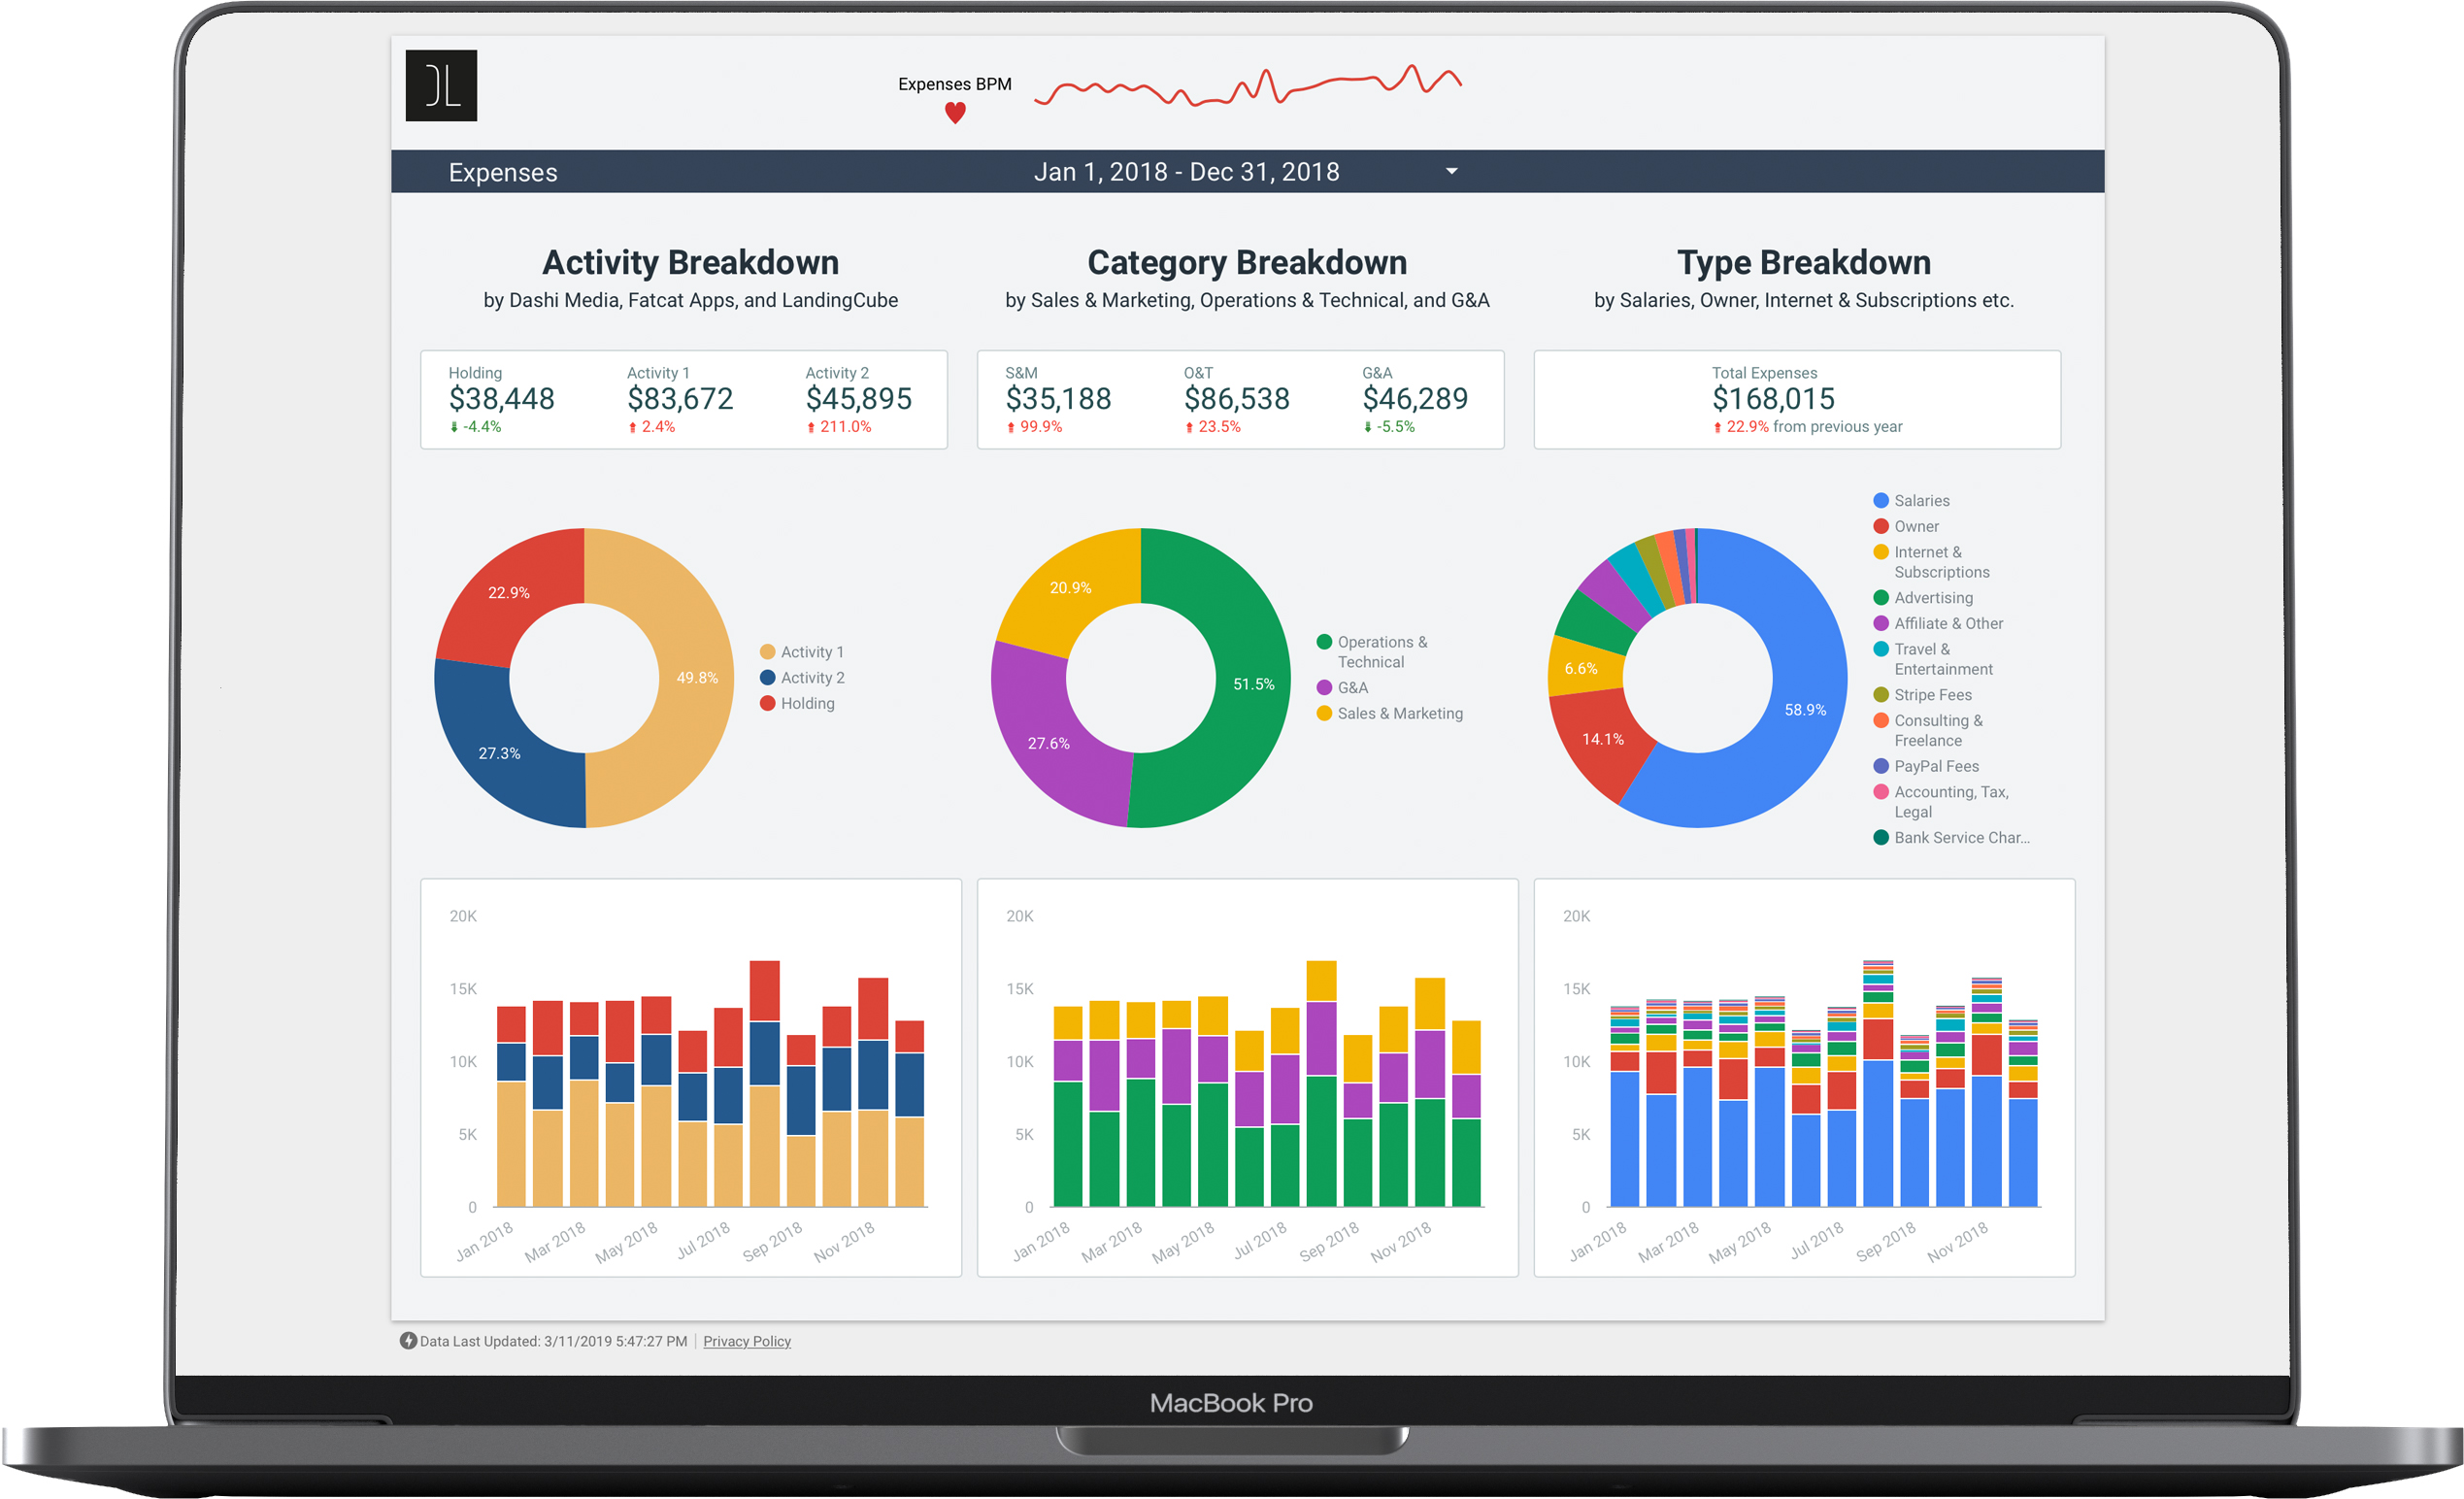
Expenses Health
Quick view on your expenses trend since the first datas recorded. Great way to spot trend reversal.
Smart Breakdown
Each breakdown equals the one next to it, widen your view by looking from different perspectives.
Total Interactivity
Only select the data you want to display by clicking on it, all charts will adjust automatically.
The entrepreneur roller coaster is not just about emotions, but about revenue too.
Imagine your sales slow down for any reason and you operate your business check-to-check. Or on the contrary, your sales speed up and you start spending like this is the new normal but the next month or quarter there is a downswing.
Monitoring what’s going out of the bank let you know which expenses are here to really help your business run efficiently versus those that are unnecessary.
Cash flow report help you visualize how revenue accumulates and where the money really goes.
Like many entrepreneurs, accumulate some cash is one of the reasons you’ve started your business if I’m guessing right. But how do you know if your company is a cash-eating monster or a cash-cow without tracking it.
Keep in mind that as your business is growing, consistent positive cash flow is hard to sustain. Your top one priority must be to constitute a cash reserve to operate your business unscathed if sales plummet.

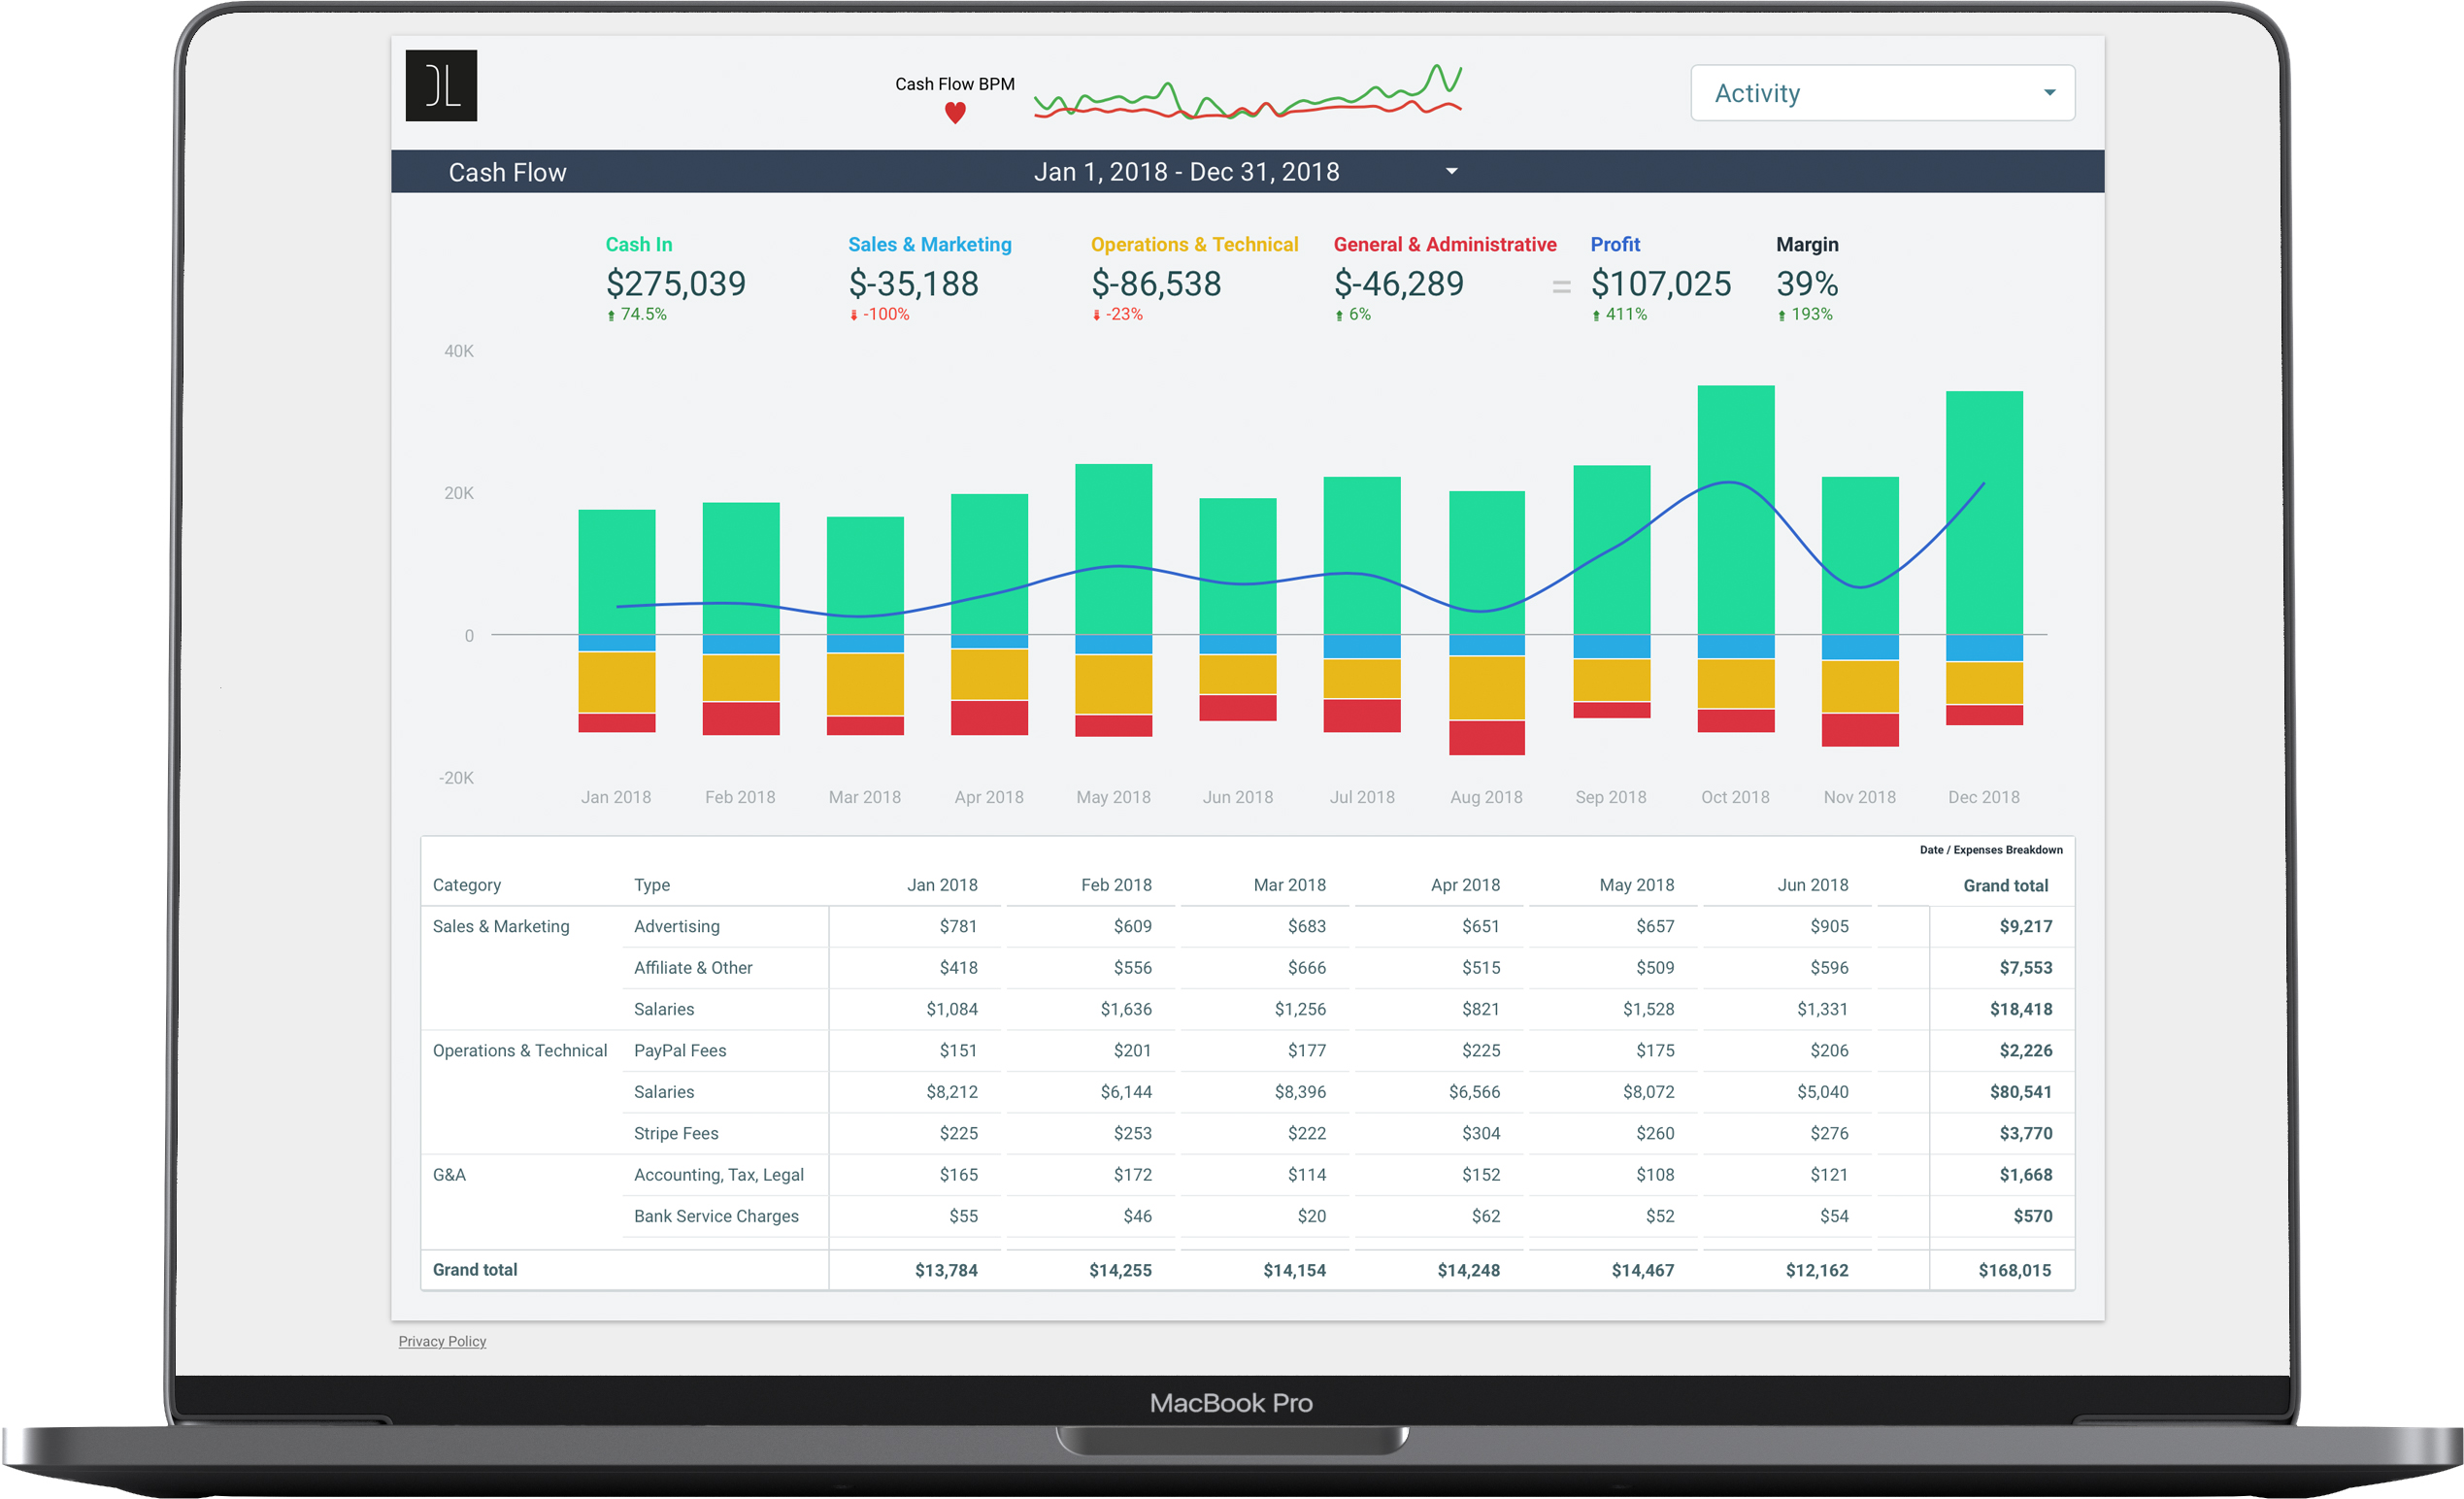
Choose Among Your Activity
Check the filter to select only numbers of a certain activity, distribution channel or leave them global.
Visual Profit Calculation
Understand the macro elements at work for your profit formation with clear numbers.
Complete Data
Know the full spectrum of what your profil is made of month after month with simple datas categorization.
Gather all your financial data from different activities and entities at no extra cost.
Get cherry-pick key financial metrics right into your inbox when you decide.
Get daily updates from all your services that integrate with the dashboard.
Connect anytime online with a login linked to your Google account for extra security.
Take a step ahead your competition by having the right key metrics in hand.
Your data are not only retrieved from all your services, they’re also checked carefully.
Your favorite business services integrate seamlessly
Ready to see how Activity Dashboard will transform your financial management process?

“Essential
The dashboard helped me make better decisions and allowed me to stop doing the finance stuff that was very time-consuming before: eCommerce and Amazon sales reporting, P&L and much more.”